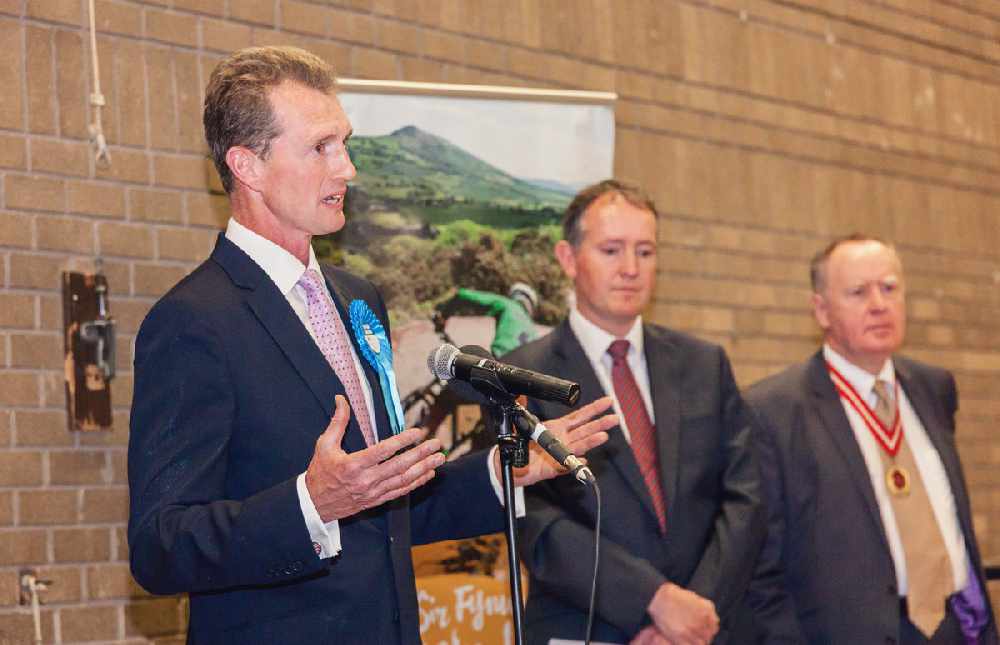
The Tories have retained seats across Herefordshire and Monmouthshire.
Herefordshire
The Conservatives have held onto the North Herefordshire seat.
Bill Wiggin was returned to parliament with a majority of 21,602 - up by over 1,000 on 2015.
Jesse Norman held Hereford and South Herefordshire with 27,004 votes.
The total number of votes received was 100,895. Verified voter turnout for Hereford and South Herefordshire was 71% and North Herefordshire was 74%.
HEREFORD AND SOUTH HEREFORDSHIRE RESULT
- Anna Coda (Labour Party) – 11,991 votes
- Lucy Ann Hurds (Liberal Democrats) – 3,556 votes
- Jim Kenyon (Independent) – 5,560 votes
- Jesse Norman (The Conservative Party) – 27,004 votes
- Gwyn James Price (UK Independence Party (UKIP)) – 1,153 votes
- Diana Stella Toynbee (The Green Party) – 1,220 votes
NORTH HEREFORDSHIRE RESULT
- Ellie Chowns (The Green Party) – 2,771 votes
- Arthur St John Devine (Independent) - 363 votes
- Jeanie Falconer (Liberal Democrats) – 5,874 votes
- Sasha Rose Alicia Norris (Independent) - 577 votes
- Roger William Page (Labour Party) – 9,495 votes
- Bill Wiggin (The Conservative Party) – 31,097 votes
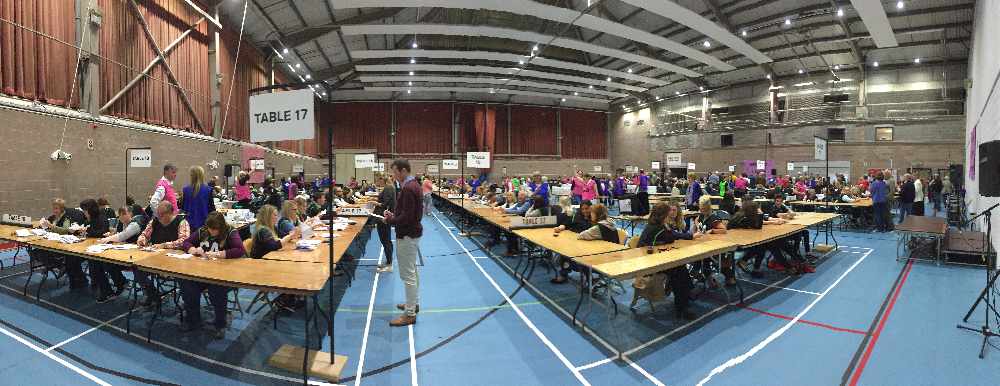
Monmouthshire
In Monmouthshire, David Davies was elected as MP for Monmouth with 53% of votes cast.
It is the highest turnout in the constituency in four elections, up nearly five per cent on the 2010 General Election.
Mr Davies, who has held the seat since 2005, praised the other five candidates for fighting a “fair and friendly campaign”.
| Election Candidate | Party | Votes | % | |
|---|---|---|---|---|
| Welsh Conservative Party Candidate | 26411 | 53% | Elected | |
| Welsh Labour/Llafur Cymru | 18205 | 37% | Not elected | |
| Liberal Democrats | 2064 | 4% | Not elected | |
| Plaid Cymru - The Party of Wales | 1338 | 3% | Not elected | |
| Green Party | 954 | 2% | Not elected | |
| UKIP | 762 | 2% | Not elected |

 Plans for re-homing centre for retired dolphins
 Revealed: The main roads in Herefordshire prioritised for repairs
 Villagers fustrated over lack of road repairs
 New Food and Drink group launched at online event
